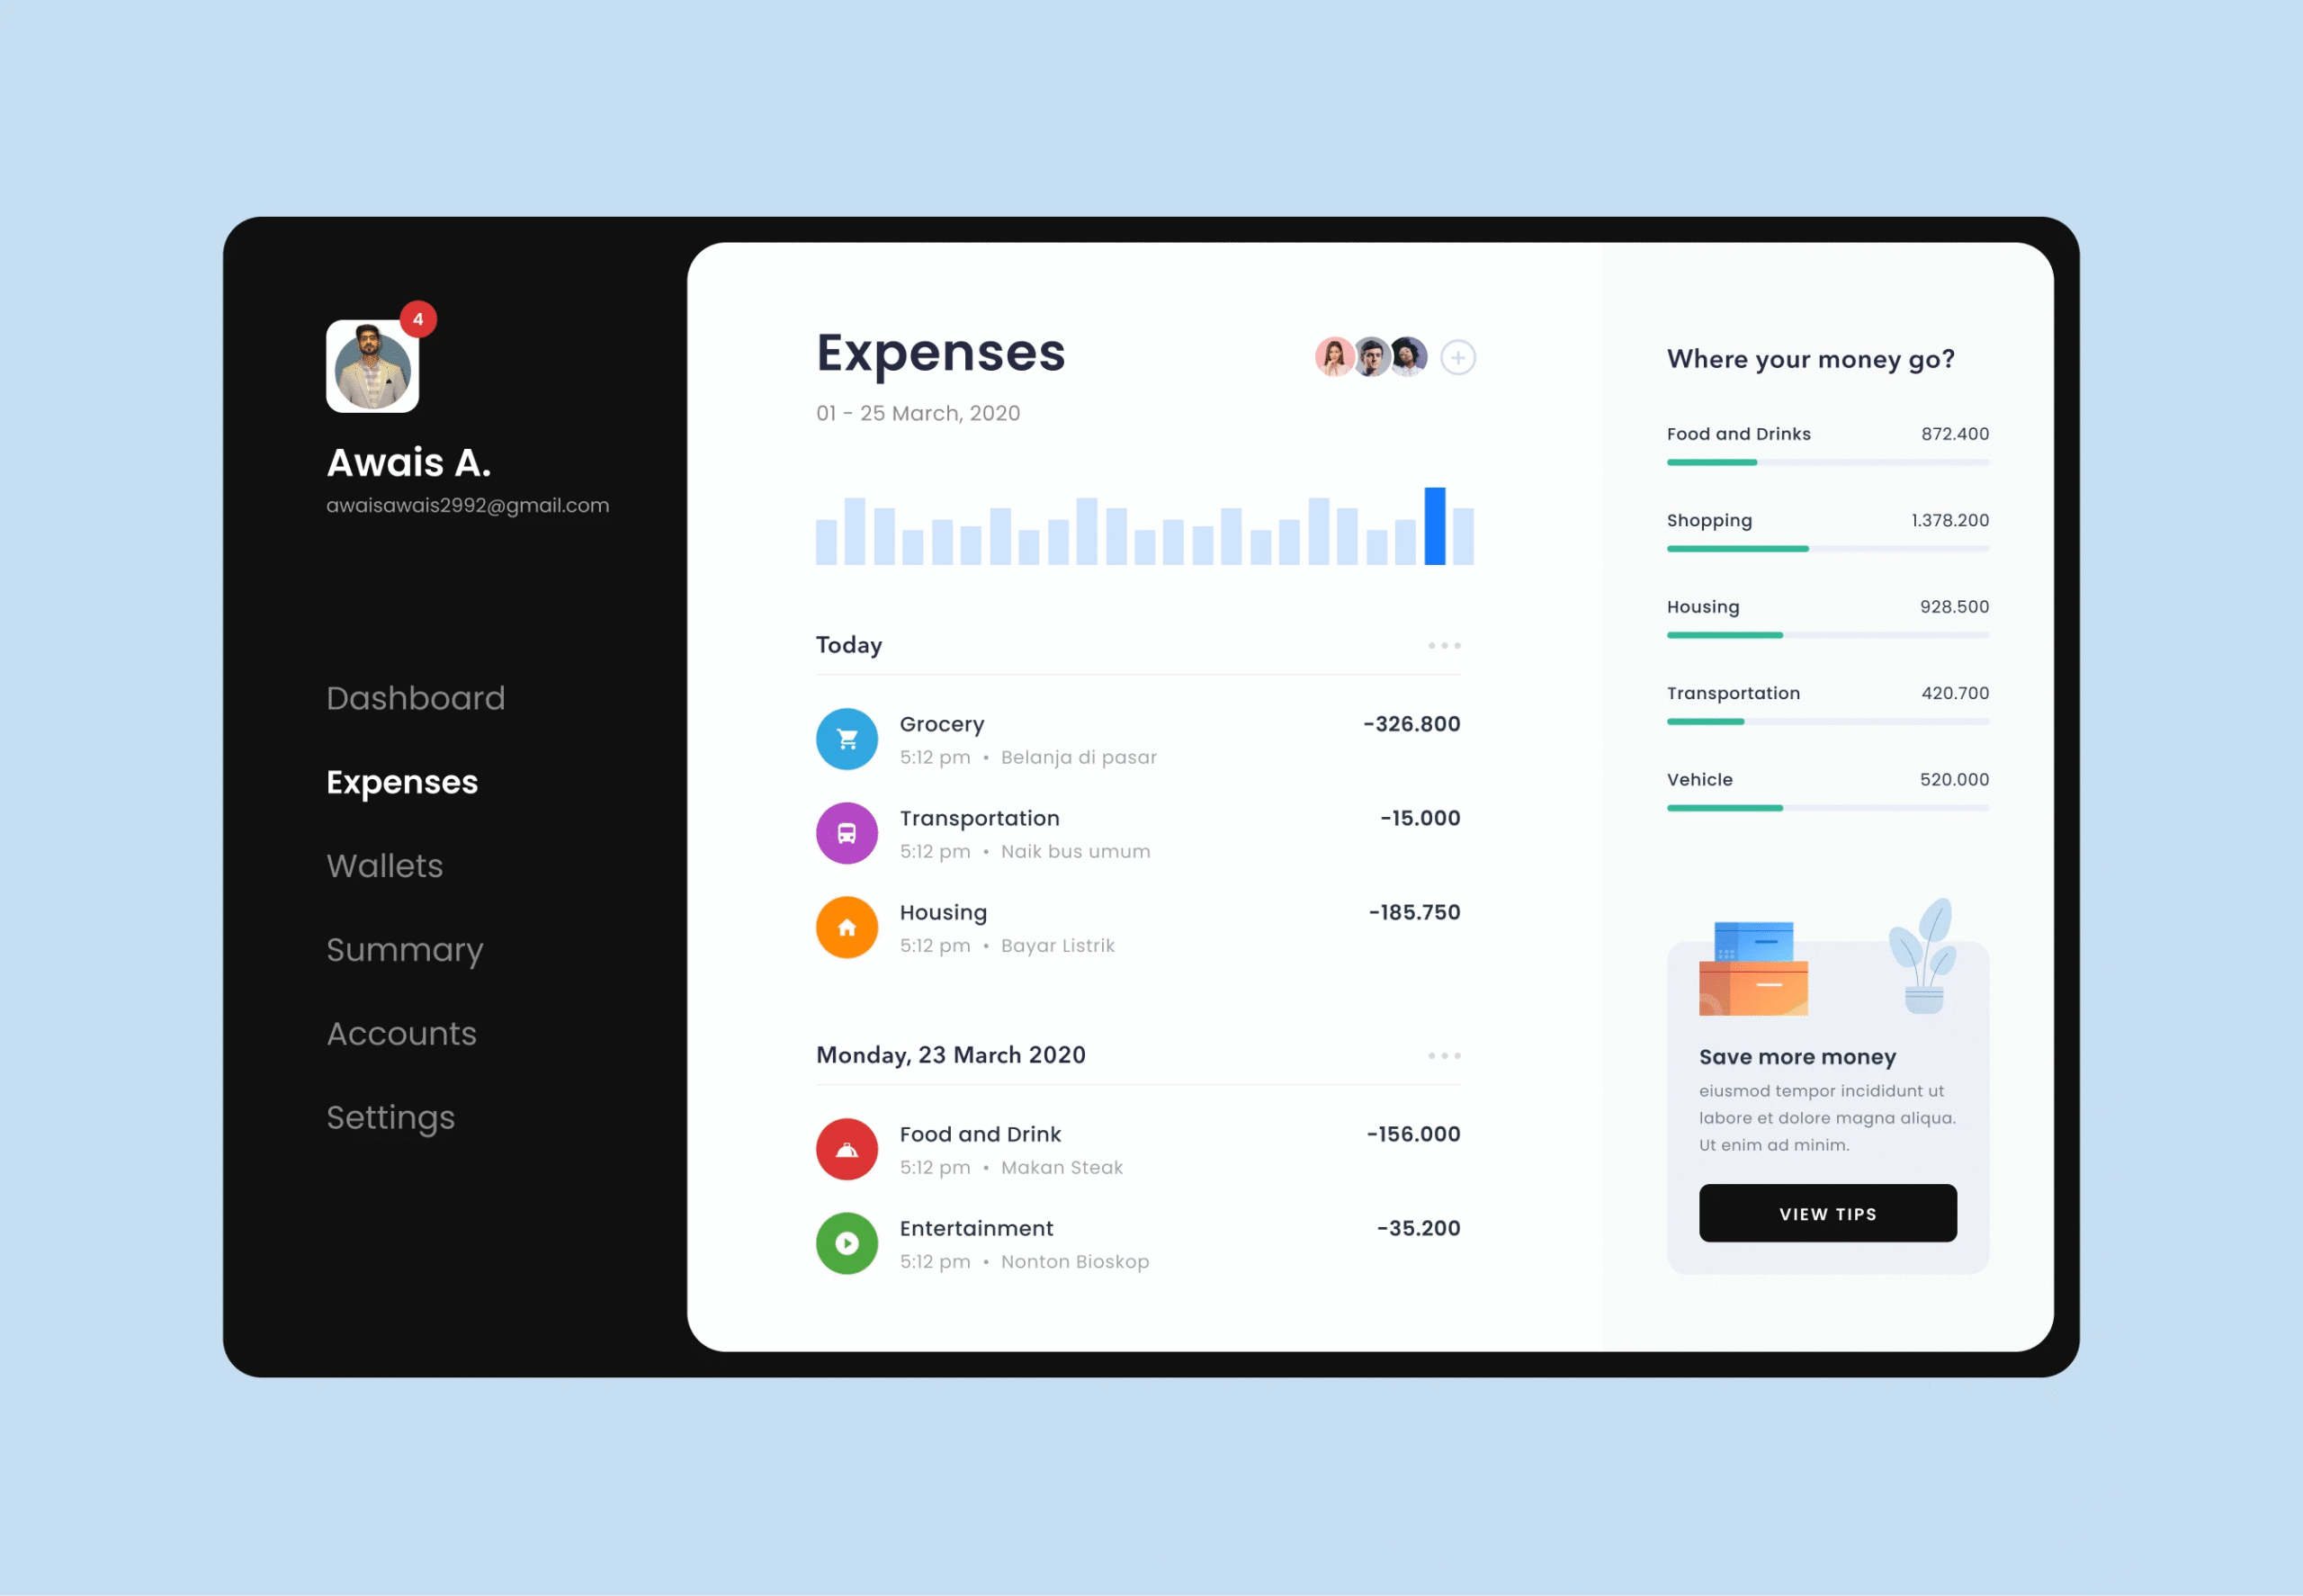
This project involved designing a financial dashboard for managing personal finance, investment tracking, and real-time wallet monitoring. The platform allows users to view and analyze their financial status, including savings accounts, investments, and cash flow. With an intuitive interface, it enables users to track their balances across various currencies, monitor cash flow trends, and stay on top of recent transactions. The goal was to create a user-friendly experience for both novice and expert users, making financial data easily accessible and actionable.
Objectives:
- Design an organized, easy-to-use dashboard for monitoring multiple aspects of personal finance.
- Provide real-time data on wallets, savings, investments, and cash flow.
- Integrate visual elements such as charts and graphs for better understanding of financial trends.
- Enable users to filter and analyze financial data across multiple timeframes (monthly, yearly).
- Ensure that users can quickly access recent activities and transactions.
Roles & Responsibilities:
- UI/UX Design: Designed the overall layout of the dashboard to ensure clarity and ease of navigation. Focused on usability, allowing users to track their financials quickly and efficiently.
- Wireframing & Prototyping: Created wireframes to structure the app’s interface, followed by interactive prototypes to showcase the user flow and ensure a seamless experience.
- Visual Design: Developed high-fidelity visuals, including color palettes, typography, and icons that represent financial concepts in a clean and approachable way.
- Data Visualization: Designed graphs and charts that represent users’ financial performance over time, making it easier for them to understand their spending and saving habits.
- Responsive Design: Ensured the dashboard was mobile-optimized to give users full access to their financial data from any device.
- Interaction Design: Focused on intuitive interactions, such as hover effects, tooltips for extra data, and smooth transitions between views, ensuring users had a positive experience.
Tools & Technologies:
- Design Tools: Figma, Adobe XD
- Prototyping Tools: InVision, Marvel
- Front-end Technologies: React for dynamic data updates and interaction.
- Backend Technologies: Firebase for real-time data synchronization and authentication.
- Charting Library: Chart.js or D3.js for interactive charts and graphs.
- Responsive Design: Media queries for consistent views across mobile and desktop devices.
Impact:
- Enhanced user engagement by providing an interactive, clear, and visually appealing dashboard.
- Improved financial management for users by offering an intuitive tool to track savings, investments, and cash flow in one place.
- Helped users make data-driven financial decisions with real-time analytics and trend tracking.
- Increased user satisfaction due to the streamlined experience and easy navigation across financial data.