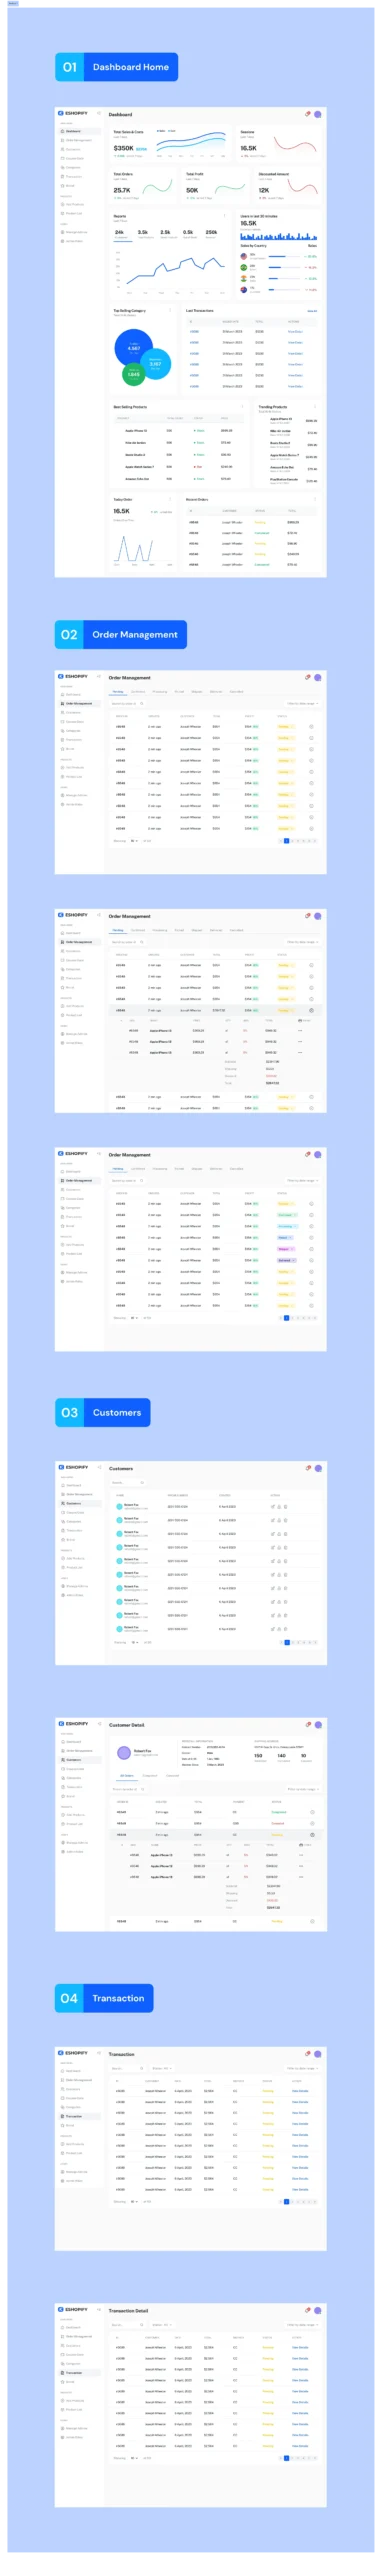
This project involved designing an intuitive and interactive e-commerce dashboard aimed at simplifying online store management. The dashboard serves as a central hub for business owners and administrators to track key metrics such as sales, profits, customer data, and order management. It offers a clean, modern user interface (UI) with dynamic data visualization, ensuring a seamless experience for users managing an online store.
Objectives:
- Create a user-friendly interface for business owners and admins to track real-time performance.
- Display essential metrics (sales, profits, orders) using visually clear charts and graphs.
- Ensure smooth navigation between different sections like customer management, order management, and transaction history.
- Incorporate intuitive filtering and search capabilities for easy data access.
- Optimize the design for desktop and mobile views, offering flexibility and accessibility.
- Provide a robust back-end data structure to support the large volume of e-commerce data.
Roles & Responsibilities:
- UI/UX Design: Developed the overall user experience and interface, ensuring that it was simple and easy to use while maintaining a modern and sleek design.
- Wireframing & Prototyping: Created initial wireframes to validate the structure, and produced interactive prototypes to get feedback and refine the interface.
- Dashboard Design: Focused on delivering visually appealing, easy-to-understand charts and graphs for displaying business data like total sales, orders, and profits.
- Data Visualization: Implemented key data visualization features such as bar charts, pie charts, and line graphs to present sales and customer data.
- Responsive Design: Optimized the dashboard for multiple devices (desktop and mobile), ensuring seamless user experiences on different screen sizes.
- Interactivity: Integrated filters, search functions, and dynamic data tables to allow users to navigate through large amounts of information efficiently.
- Collaboration with Developers: Worked closely with the development team to ensure the design was correctly implemented and the data was displayed accurately.
Tools & Technologies:
- Design Tools: Figma, Adobe XD
- Prototyping Tools: InVision, Marvel App
- Front-end Technologies: HTML5, CSS3, JavaScript, React.js
- Data Visualization Libraries: Chart.js, D3.js (for rendering graphs and charts)
- Responsive Design: Media Queries for optimized display on mobile and tablet devices
Impact:
- Improved Data Accessibility: Provided users with a central place to monitor critical business metrics, enhancing their ability to make data-driven decisions.
- Enhanced User Experience: The interactive design elements, such as filterable data tables and clear data visualization, ensured that users could easily navigate and understand the information.
- Increased Efficiency: The clean and well-organized dashboard allowed e-commerce administrators to efficiently manage customer data, orders, and sales without feeling overwhelmed by information overload.